Investing in Growth
Finance & Development, March 2011, Vol. 48, No. 1
Revisiting the debate over whether public investment in infrastructure is productive

But they can find this difficult to achieve. For various political reasons, these countries are often unable to cut less productive current spending—for example, on general subsidies for fuel—to increase public investment. They can seek funds from external sources, but may face limits on how much their country can borrow—particularly if it has benefited from debt relief in recent years or if additional borrowing is available only on nonconcessional terms. Moreover, a long legacy of failed public projects in a number of countries further complicates decisions about external borrowing.
But more important than whether a country can expand its public investment in infrastructure is whether it should. Underlying the debate over increasing public capital is the question of the productivity of public investment—whether it aids economic growth. If public investment is productive, it is easier to justify external borrowing to support it. Unfortunately, the results of studies on public investment’s impact on growth are unclear, leading many to conclude that it is unproductive.
However, some recent studies—for example, by the World Bank (2007)—conclude that public spending on infrastructure, education, and health yields positive effects on growth. The report from the Commission on Growth and Development (2008) notes that fast-growing countries are characterized by high public investment, defined as 7 percent of gross domestic product (GDP) or more.
However, some recent studies—for example, by the World Bank (2007)—conclude that public spending on infrastructure, education, and health yields positive effects on growth. The report from the Commission on Growth and Development (2008) notes that fast-growing countries are characterized by high public investment, defined as 7 percent of gross domestic product (GDP) or more.
This article revisits this debate and, using estimates of the total amount, or stock, of public capital (be it bridges or highways), it studies the impact on economic growth for 48 advanced and developing economies during 1960–2001. It finds that public investment generally has a positive impact on growth.
Mixed results
Some of the discrepancy in existing findings relates to what is being measured. Many studies look at the investment rate—the percentage of GDP devoted to adding to the capital stock. We find that the more important focus is the rate of growth of the capital stock itself. The discrepancy between the two suggests at least three reasons for the mixed evidence on the relationship between public investment and overall economic growth:
•Public investment and public capital can grow at different rates, depending on the initial level of capital stock. For example, public investment in a given year may not be large enough to replace the depreciated capital stock—the amount of capital “used up,” say by the wear and tear on a highway or a bridge from automobile and truck traffic. One cannot expect public investment to have a positive impact on growth if it is not big enough to keep the country’s capital stock from declining.
•There is a two-way relationship between public investment and growth that makes it difficult to isolate the effect of one on the other: public investment affects growth, but it is also affected by growth. For example, public investment may fall during an economic downturn simply because of a lack of resources, which is typical in many countries.
•Most studies do not take into account that governments face a budget constraint—they must finance higher investment spending either by raising taxes or borrowing or by cutting other spending. Higher taxation to finance public spending could introduce distortions in the economy and offset some of the productivity gains from public investment.
Economic theory suggests that the level of output is determined by the capital stock employed in production, rather than the annual investment flow. Although the two variables are closely linked, the capital stock—together with other production factors, such as labor and technology—determines an economy’s production potential. The investment flow in any given period, by contrast, determines how much capital is accumulated and therefore available for production in the subsequent period.
Focus on public capital growth
Box
The production function approach
In economic theory, an aggregate production function is a formal depiction of how inputs are transformed into output. In the standard model, the level of output depends on just two inputs, labor and capital, and on the available technology. This relationship is commonly specified as a Cobb-Douglas function, named after the mathematician Charles Cobb and Paul Douglas, an economist, who later became a U.S. senator from the state of Illinois. When tested empirically, the Cobb-Douglas function yields estimates of the responsiveness of output to a variation in inputs. In a first step, we extended this basic specification by dividing capital into private capital (provided by firms) and public capital (such as infrastructure provided by the government) and estimated the importance of the latter on output. In the second step, we allowed the responsiveness of output to public capital to vary with the level of public capital itself and found the relationship depicted in Chart 3.
As a result, we focus on the growth effect of public capital—the stock variable that corresponds to public investment. In particular, we developed a production function (see box) that includes inputs of labor, private capital, and public capital to determine the total output of an economy. We modified the production function to allow the productivity of public investment to vary, depending on the initial amount (stock) of public capital.
For example, maintaining and/or expanding the existing capital stock may require higher tax rates, which could be distortionary—that is, discourage some good economic activities—and lead to lower growth. In our specification, we indirectly allow for the effect of such financing constraints.
For example, maintaining and/or expanding the existing capital stock may require higher tax rates, which could be distortionary—that is, discourage some good economic activities—and lead to lower growth. In our specification, we indirectly allow for the effect of such financing constraints.
To test our model, we needed estimates of public and private capital stock. But such estimates are difficult to obtain. Some are available for advanced economies, but there are few for developing economies. In our study, we filled this gap by estimating the public and private capital stock for a group of middle- and low-income countries during 1960–2001 using a methodology proposed by Kamps (2006).
Our data set is novel in several ways: it combines capital stock estimates for both advanced and developing economies, differentiates between public and private capital, and applies depreciation rates that vary by time and by the economy’s income level to capture the nature of the underlying public and private assets.
Our data set is novel in several ways: it combines capital stock estimates for both advanced and developing economies, differentiates between public and private capital, and applies depreciation rates that vary by time and by the economy’s income level to capture the nature of the underlying public and private assets.
Specifically, the value of the capital stock is calculated using the perpetual inventory method. In this method, the net capital stock—public and private—is determined by adding gross investment flows from the current period to the depreciated capital stock of the previous period. As a result, the stock data account for the wear and tear on assets.
The choice of depreciation rates presents perhaps the biggest challenge to tallying the capital stock data—mainly because country-specific estimates of depreciation rates (how much of the capital stock is used up in a period) are typically not available. Instead of applying a uniform rate to all countries, we differentiate the assumed depreciation by groups of countries reflecting different types of assets typically available in those countries. These assets have different life spans, resulting in different depreciation rates.
For example, concrete structures are typically estimated to last longer than assets related to technology, whose investment life may be only a few years. As countries become richer, the share of assets with shorter life spans rises, thereby raising the overall depreciation rate.
The U.S. Bureau of Economic Analysis estimates that overall depreciation rates for public capital in the United States were about 2½ percent per year in 1960 and 4 percent in 2001 (Bureau of Economic Analysis, 2010). We extended this assumption to the public capital stock estimates for all advanced economies in our sample. For middle-income countries, we used a time-varying profile in which the depreciation rate starts at 2½ percent in 1960 and reaches 3½ percent by 2001. We assumed a constant rate of depreciation of 2½ percent for low-income countries throughout the sample period. We confirmed our findings using other plausible depreciation rates.
To construct the capital stock data set we used internationally comparable investment series from the Penn World Tables (PWT—Heston, Summers, and Aten, 2006) combined with the IMF’s World Economic Outlook (WEO) database. The PWT provide data on output and investment based on national accounts and adjusted for purchasing power parity. One drawback of the PWT is that they do not break down investment into its public and private components, an essential ingredient for our analysis. For that, we turned to the WEO database, whose data are broken down according to public and private investment. We used this share of public and private investment in total investment to split the PWT investment series into public and private components.
Public investment and capital stock divergence

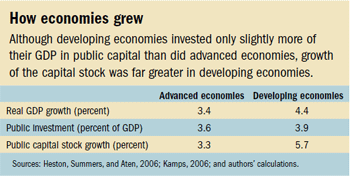
On average, GDP grew by 3.4 percent in advanced economies and 4.4 percent—1 percentage point more—in developing economies from 1960 to 2000 (see table). Despite the higher growth in developing economies, the average public investment rates in advanced and developing economies were similar during this period. In particular, average public investment was 3.6 percent of GDP for advanced economies and 3.9 percent for developing economies.
Although the investment rates were similar, the capital stock itself grew almost twice as fast in developing economies as in advanced economies during 1960–2000, because much of the investment in advanced economies replaced worn-out capital stock. This difference in capital stock accumulation helps explain much of the long-term growth differential across countries.
Although the investment rates were similar, the capital stock itself grew almost twice as fast in developing economies as in advanced economies during 1960–2000, because much of the investment in advanced economies replaced worn-out capital stock. This difference in capital stock accumulation helps explain much of the long-term growth differential across countries.

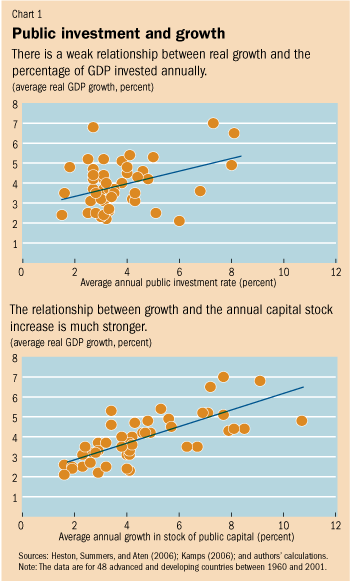
Chart 1 shows a scatter plot of the average GDP growth, public investment rate, and public capital growth during 1960–2000 for all countries in the sample. It shows that cross-country differences in public capital growth explain much of the difference in long-term GDP growth during this period.
In particular, the correlation between average public capital growth and average GDP growth is much higher than between the average public investment rate and GDP growth.
In particular, the correlation between average public capital growth and average GDP growth is much higher than between the average public investment rate and GDP growth.
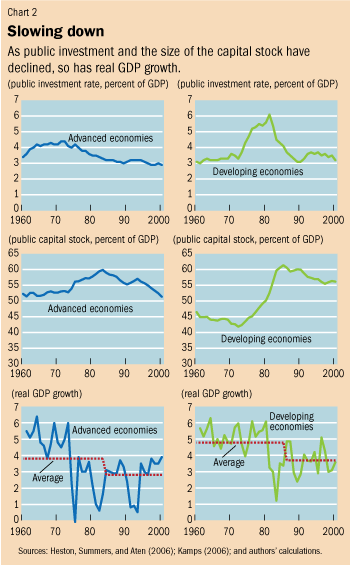
Chart 2 plots the average GDP growth, public investment rate, and public capital stock for advanced and developing economies from 1960 to 2000.
It shows that the public investment rate has been on a downward trend since the early 1970s in advanced economies. In contrast, the public investment rate increased significantly in developing countries in the 1970s, although it returned to its earlier levels in the 1980s. Public capital stock, as a percent of GDP, peaked for advanced economies in 1983 and for developing economies in 1985.
The peak levels were 60 percent of GDP for advanced economies and 61 percent of GDP for developing economies. The bottom panel of the chart shows the behavior of real GDP growth during this period. In both advanced and developing economies, there was a downward shift in real growth of almost 1 percentage point on average around the time capital stock peaked.
Growth impact of public capital varies

We first tested a production function that relies on investment flows instead of capital stock. As argued above, the net capital stock is the key determinant of productivity, and investment flows do not provide any information on the share of investment required to replace depreciating capital stock. Unsurprisingly, then, these models do not demonstrate a relationship between investment flows and growth.
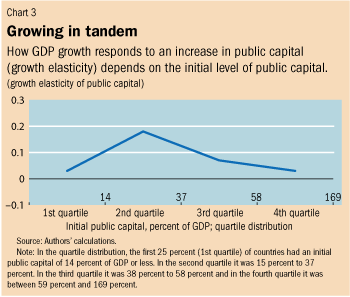
But when we tested a production function that relies on capital stock, we found that public capital has a positive effect on growth. We then found that the growth impact of capital stock varies with the level of public capital in the economy. In countries with public capital stock valued at less than 60 percent of GDP, an additional unit of public capital has the highest impact on growth (Chart 3).
The effect diminishes thereafter, and for countries with very high public capital stock the growth effect is close to zero, possibly reflecting the inefficiencies that arise from financing public capital, such as high taxation. These results are robust under a variety of assumptions and with the inclusion or exclusion of outlier countries.

The effect diminishes thereafter, and for countries with very high public capital stock the growth effect is close to zero, possibly reflecting the inefficiencies that arise from financing public capital, such as high taxation. These results are robust under a variety of assumptions and with the inclusion or exclusion of outlier countries.

We also explored public capital’s growth impact over time intervals. Long-term effects of public capital accumulation on growth may not be captured sufficiently in annual data. For example, some public investment may take more than a year to complete, and even when completed, the payoff may accrue over a longer period. Hence, longer time horizons, such as five-year intervals, may be better suited to capture the lumpiness of investment and lags in its effectiveness. We found that in advanced economies, the effects of public capital on growth, although significant over the short term, diminish over long time horizons.
For developing countries, on the other hand, the effect increases as the time horizon lengthens, and is largest for five-year intervals. These results suggest that some developing countries may not be able to handle significantly higher capital investment immediately because of their limited capacity to absorb investment and/or their slow implementation of investment projects. Furthermore, the results indicate that advanced economies use public investment more as a demand management tool—to counter the business cycle—than do emerging and developing economies, where it is more likely used to boost long-term growth.
Policy implications
Increases in public capital stock are associated with higher growth, especially after controlling for the initial level of public capital. The short-term effects are stronger for advanced economies, the long-term effects stronger for developing economies. These findings help explain why previous studies that focus on the investment rate as the explanatory variable produced mixed results. At the same time, we found that in some countries the positive impact of public capital on output is partially or wholly offset if the initial capital stock in relation to GDP is high. However, these considerations do not seem to matter in countries with relatively low public capital stock.
These results suggest two broad policy implications. First, debate over how much additional debt a country can take on has centered on creating room in the budget for higher public investment, but our results show that certain types of constraints—for example, financing—can limit higher capital stock’s benefits on growth. Second, developing countries can gain from nonconcessional foreign borrowing to finance new investment; however, the benefits from such investment may accrue only over time. ■
Serkan Arslanalp is an Economist in the IMF’s Monetary and Capital Markets Department. Fabian Bornhorst is an Economist and Sanjeev Gupta is Deputy Director, both in the IMF’s Fiscal Affairs Department.
References:
Arslanalp, Serkan, Fabian Bornhorst, Sanjeev Gupta, and Elsa Sze, 2010, “Public Capital and Growth,” IMF Working Paper 10/175 (Washington: International Monetary Fund).Bureau of Economic Analysis, 2010, “Fixed Asset Tables,” available at http://www.bea.gov/national/FA2004/SelectTable.asp
Commission on Growth and Development, 2008, The Growth Report: Strategies for Sustained Growth and Inclusive Development (Washington: World Bank).
Heston, Alan, Robert Summers, and Bettina Aten, 2006, “Penn World Table Version 6.2,” Center for International Comparisons of Production, Income and Prices at the University of Pennsylvania (Philadelphia: University of Pennsylvania, September).
Kamps, Christophe, 2006, “New Estimates of Government Net Capital Stocks for 22 OECD Countries 1960–2001,” IMF Staff Papers, Vol. 53, No. 1, pp. 120–50.
World Bank, 2007, Fiscal Policy for Growth and Development: Further Analysis and Lessons from Country Case Studies (Washington).
---------------
đếch biết tiếng anh
Trả lờiXóa